MIVARE LABS WORKS AUTOMOTIVE GARAGE MANAGEMENT SYSTEM
06 / REPORTS · Mivare Works
06 / REPORTS

Reports on which you can base your decisions.

Customers, parts usage and sales performance, with a chart, a choice of period and a comparison with the previous period. Reports use the data recorded in jobs, stock and working time.

WHY IT MATTERS

Decisions based on data, not on a gut feeling about last week.

Without reports it is hard to tell which customers generate the revenue, which parts tie up capital, and at which sales stage the garage loses enquiries. The reports answer these questions from your job data.

CUSTOMERSPARTSSALES

01 / CUSTOMERS

Who really generates the revenue

A handful of regular customers and fleets often account for most of the turnover, but without a report it is hard to show.

The report shows your most valuable customers and the share of businesses and private individuals in revenue.
02 / PARTS

Usage instead of guesswork

Parts purchasing planned from memory leads to shortages of some items and surpluses of others.

The usage report shows which parts are used most often and which jobs they go to.
03 / SALES

Where the garage loses enquiries

The number of calls does not tell you how many end in a job, or at which stage customers drop out.

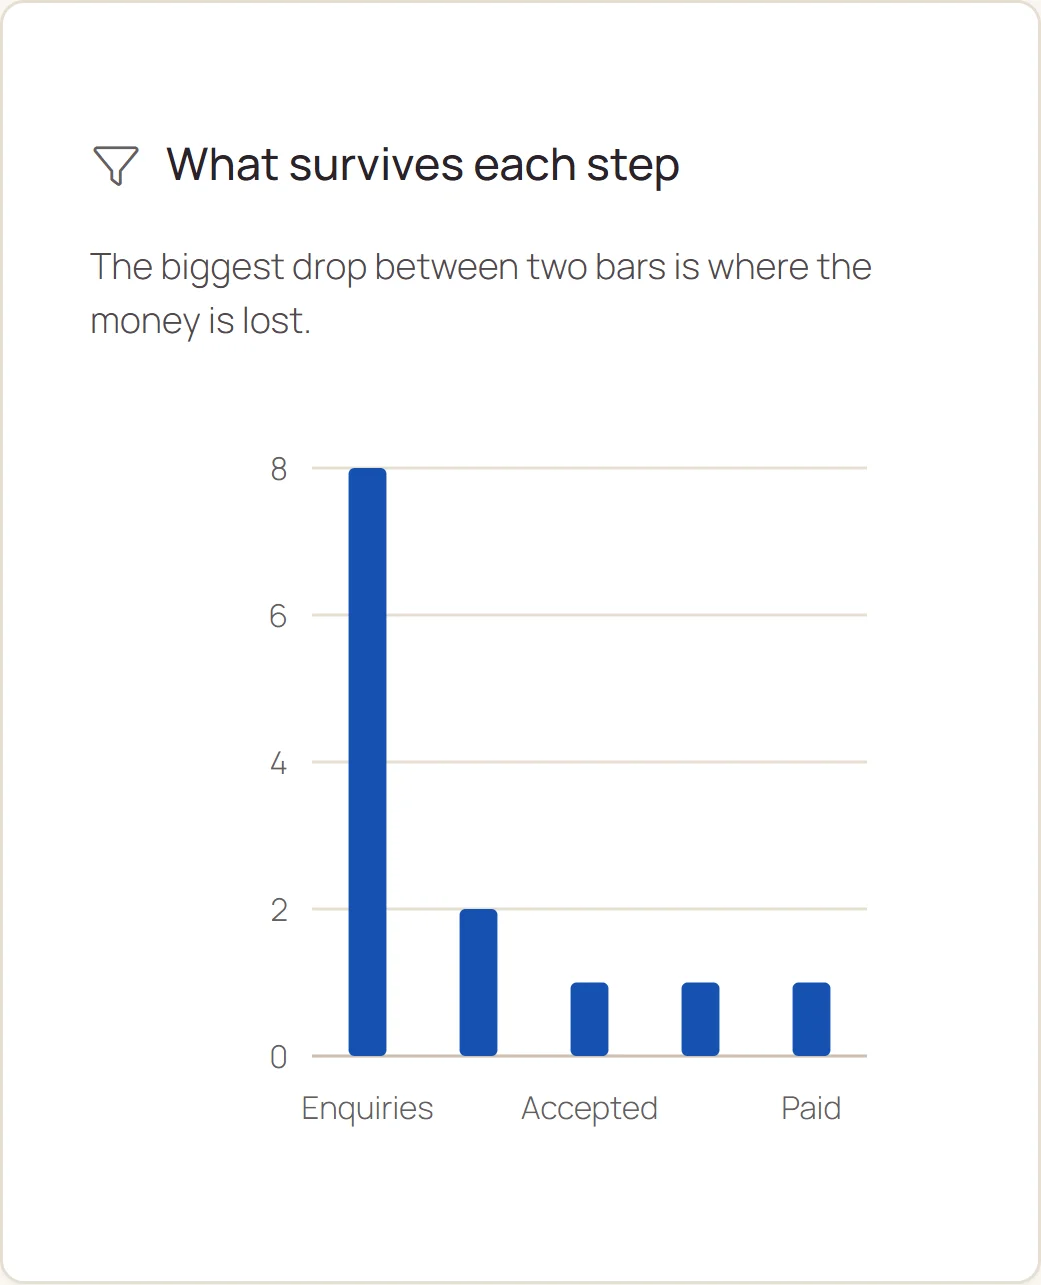
The sales funnel shows the path from enquiry, through quote, to job.
SYSTEM FEATURES

Ready-made reports from the first closed job.

Every report has a chart, a choice of period (week, month, quarter or any range), a comparison with the previous period and export to a spreadsheet. With several locations, a report covers one, selected locations or all of them.

CHARTPERIODCOMPARISONEXPORT

01 / CUSTOMER REPORT

The structure and value of your customer base.

The report shows the number of customers, new and returning, in the selected period, and revenue from customers compared with the previous period. Charts show the share of businesses and private individuals in revenue, and the ten customers who spent the most.

  • You know which customers your garage's revenue rests on.
  • The share of returning customers reflects the quality of service.
Customer report: total customers, new in range, returning, and revenue from customers
02 / CUSTOMERS IN NUMBERS

Businesses, private individuals and key customers.

One business can be worth as much as a dozen or more private customers. The revenue-share chart and the ranking of your most valuable customers show where it pays to build long-term relationships and individual terms.

  • Offers for fleets and regular customers are based on actual turnover.
The share of private individuals and businesses in revenue The ten most valuable customers in the selected period
03 / PARTS USAGE

What leaves stock and for which jobs.

The parts report shows the most frequently used items and splits usage value by type of work: scheduled servicing, mechanical repairs, painting, bodywork. Stock with no movement is shown on the separate Stock rotation screen.

  • Parts purchasing is based on actual usage.
  • You can see which types of work use the most material.
The ten most frequently used items Value of parts usage by type of work
04 / SALES FUNNEL

From enquiry to job, step by step.

The sales funnel sets out enquiries, quotes and jobs, and the conversion at each stage. The biggest drop between two stages shows where the garage loses customers.

  • How well enquiries are handled can be measured.
  • Changes in how you quote can be judged by the results.
Sales funnel: number of enquiries, quotes and jobs at each stage
TRIAL

Your first report after your first closed job.

The reports need no configuration or data-collection period. The chart, date range and export work from the first settled job.

The more jobs in the system, the fuller the picture of your garage.

Register your interest
  • Do I have to install anything? No. The system runs in the browser.
  • Can the data be exported? Yes. Every report can be exported to a spreadsheet.
  • Do the reports cover several locations? Yes. One, a selection, or all at once.