


01What it is
Usage is counted from stock movements of type used on job, less returns. A part bought and sitting on the shelf is not included, because that is stock, not cost.
The Sources and prices tab shows purchases from parts orders, suppliers and the cheapest offer from the price history. It is visible to people with the finance permission.
- WHAT GOES OUT
- The most used parts and the rate of use.
- WHAT FOR
- Usage split by type of work.
- SOURCES AND PRICES
- Suppliers, prices and items without a purchase price.
02What it is for
The right minimum
The rate of use suggests how much to keep in stock.
Material cost
Usage value over time.
Better buying
The cheapest offer and each supplier's share of purchases.
03Main options
The report has a Usage tab, and for people with access to finance also Sources and prices.
What goes out and how much
Tiles: items in movement, units consumed, value consumed, what for.
- Most used and usage over time
- What the parts go into: types of work
- Table: units, value, jobs, how often, what for
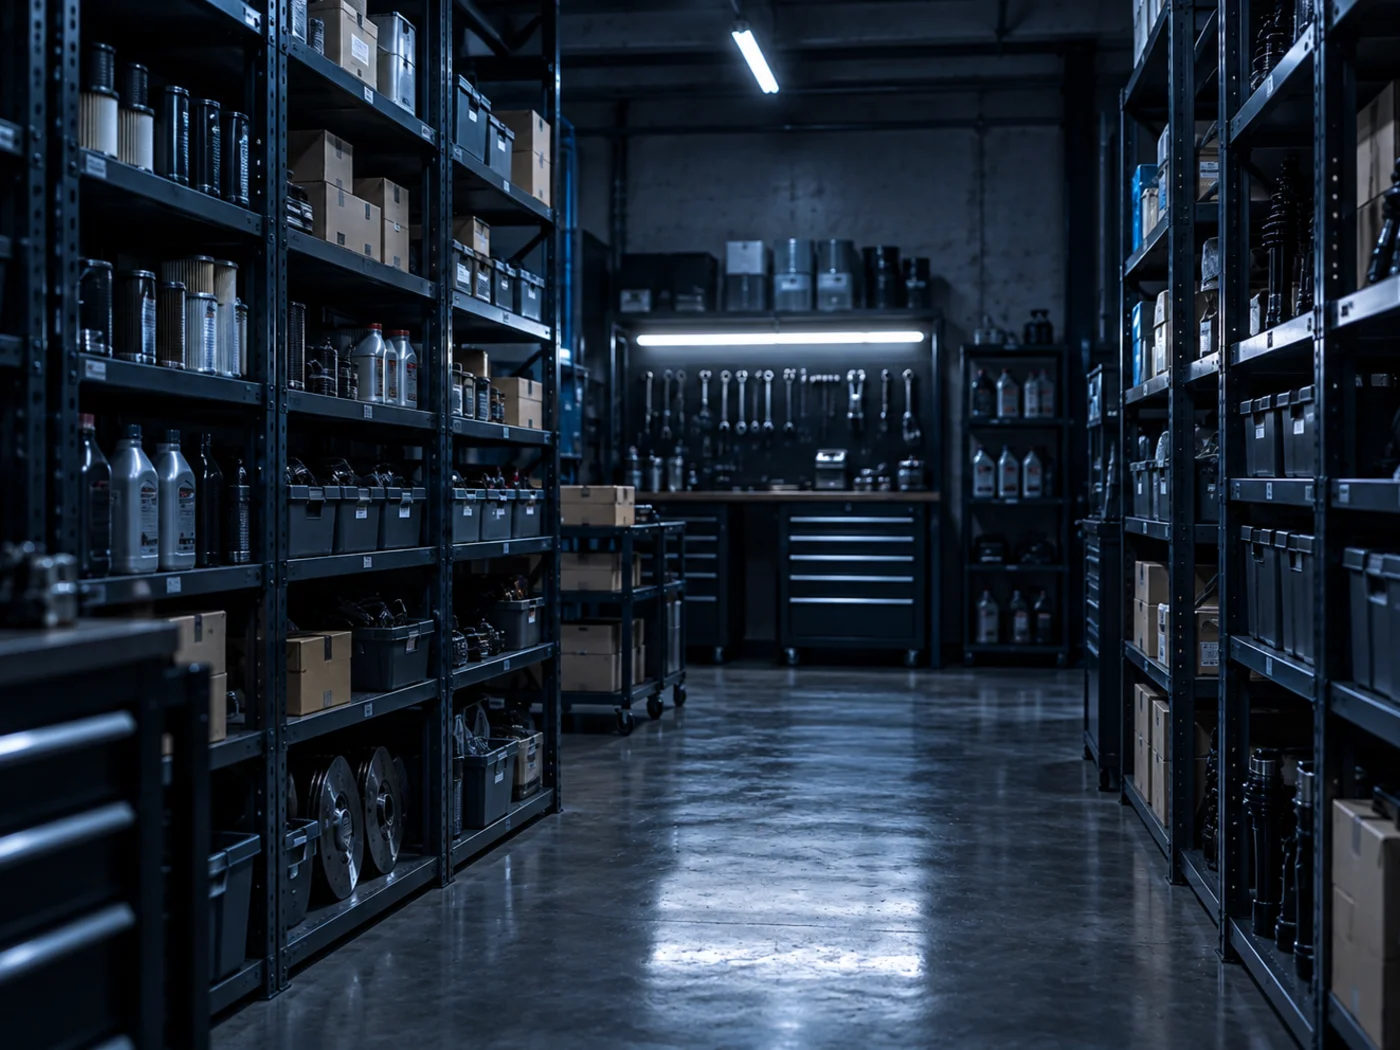
Suppliers and prices
For people with access to finance.
- Who we buy from: each supplier's share of purchases
- Purchase price and number of suppliers for every part
- Items without a purchase price
04Tasks step by step
- STEP 1Open Modules › Reports › Parts and usage, Usage tab.
- STEP 2Set the 90 days range and check the most used ranking.
- STEP 3Set the minimum for those parts in Stock levels.
- STEP 1In Sources and prices check the no purchase price tile.
- STEP 2Fill in prices with a supplier price list import or on the product record.
05Actions
The most common tasks in the parts report.
Date range
Compared with the previous period.
Export CSV
Usage and part sources.
06What it connects to
Choose a module to see where the data comes from.
Price list import
A price list import fills in purchase prices.
Go to the topicPrice list importStock rotation
What sits without movement is shown in stock rotation.
Go to the topicStock rotation